
 Search Here
MISC
Parts List
Robot Forum
Chat
Member Pages
Axon MCU
Robot Books
Shop
Contact
SKILLS
How To Build
A Robot
Tutorial
Calculators
Mechanics
Programming
Miscellaneous
Robots
Space
HARDWARE
Actuators
Batteries
Electronics
Materials
Microcontrollers
Sensors
SCIENCE
Robot Journals
Robot Theory
Conferences
with the Axon Mote
Hurricane Sandy
I grew up in Louisiana so hurricanes aren't really a big deal for me. Except for maybe Katrina but let's stay on topic here . . .
Anyway, I live near DC now and so when there is a hurricane, the locals freak out. For example, Irene, and more recently, Sandy.
Sandy was barely even a Cat 1, and DC was on the weak side of the storm.
Forecasters were predicting hurricane Sandy to collide with a wintry system. So when two major storm systems were set to collide, the good 'ol media hyped it up as 'Frankenstorm'. Folks, hurricanes require warm air to live, and winter storms require cold air. So when you put +1 and -1 together, you get zero. Well, ok, when a hurricane dies it dumps large quantities of rain, and some states got heavy amounts of snow. The damage to New York and New Jersey were from the rise in the tide (they were also hit by the stronger side, too).
Anyway, forecasters predicted the areas which the storm hit would have record low air pressures. So I got to thinking, wouldn't it be fun to measure it? How often do I get a chance to measure a hurricane!
Experimental Setup
I've done several high-altitude balloon experiments in the past, so I have various pressure and temperature sensors laying around.
And software already written for them. So it only took me ~2 hours to write up some working code and get everything wired up.
Parts
1) Axon Mote, because it has an SD card slot.
2) BMP085 Breakout by Sparkfun for pressure and temperature measurement
3) A 3.7V 2600mAh Li-ion battery, Tenergy 18650. It can handle low temperatures, and has a protective circuit built in.
4) Wire connectors
Source code: Axon_Mote_Measure_Frankenstorm.zip
Note: you must use WebbotLib. See Getting Started with Axon Mote for setup details.
Plug the battery into the header labeled B (for battery), and the sensor into the I2C header labeled G 3 C D (for Ground, 3.3V, SCL, SDA). This will take you all but 5 seconds thanks to the convenient header system.
The software blinks the green LED during each reading, just to let me know it's working fine. (is the battery dead? memory card full? etc.)


I then put it on the window sill of my bathroom, as I could open the window and still isolate that room from the rest of my place. The problem with this setup, of which I was fully aware of, is the expected temperature swings when I shower . . . You'll see short-lived temperature spikes later in the data.


Data
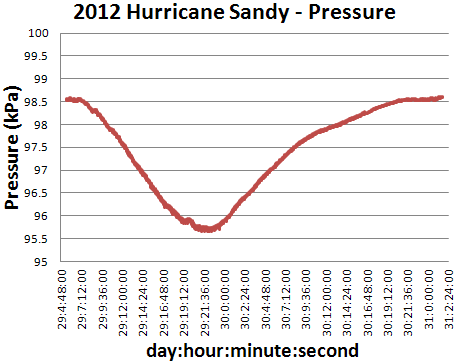
The below chart plots the temperature and pressure over time. It took a reading every 5 seconds, for less than 3 days, filling up 424kb
of memory on my 8gb memory card.
For those who don't know, 100 kPa is 1 atm. I cropped off the data before and after the hurricane, of which didn't vary much from the beginning and end of the chart anyway.
The local weather station, a 2 minute drive from me, recorded the lowest pressure of 96,026.96 pascals (96 kPa) on the night of October 29th. However, the station has no data for the 30th, so perhaps power went out for them. It would have been nice to compare data . . .
I recorded a minimum (record?) pressure of 95.649 kPa, which is about what the forecasters were predicting a day or two before. The pressure dropped very slowly, taking about 20 hours to drop 3 kPa.
I really did think temperature would have looked similar to the pressure curve. But instead, it just kept getting colder and colder . . . Temperature fluctuated much more than I expected, too. And of course, it's obvious when I showered, lol.

Society of Robots copyright 2005-2014