
 Search Here
MISC
Parts List
Robot Forum
Chat
Member Pages
Axon MCU
Robot Books
Shop
Contact
SKILLS
How To Build
A Robot
Tutorial
Calculators
Mechanics
Programming
Miscellaneous
Robots
Space
HARDWARE
Actuators
Batteries
Electronics
Materials
Microcontrollers
Sensors
SCIENCE
Robot Journals
Robot Theory
Conferences
=== Measuring Temperature ===
Introduction to Temperature for Space Balloon Flights
The temperature of the atmosphere at different altitudes isn't just a few neat data points -
it's knowledge necessary to insure a successful flight of your balloon.
Extreme temperatures can easily cause your electronics to fail, ending the entire expensive mission prematurely.
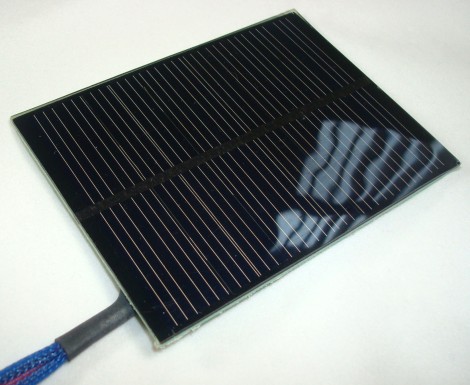
The temperature is also important for solar panel efficiency, as described in my
solar panel tutorial (hence the above pic of my solar panel).
So just how cold (or hot) does it get up there in space?
Preparing for the Space Flight
The external temperature sensor I used is as pictured below. It's no longer sold and for good reason -
it was poorly designed by the manufacturer. But it did the job and that was good enough for me.

The internal temperature sensor I used was the BMP085 by Bosch, conveniently sold as the BMP085 Breakout by Sparkfun for $20. It also has a pressure sensor, both of which were pressure/temperature calibrated for high(er) accuracy. It outputs by I2C.

Before you send your package up to space, it's a very good idea to first test your temperature measurement system at home. I did this by putting my package in the freezer, and again out in a warm room. I admit that it's not entirely representative of the much more extreme temperatures it'll experience in a typical flight, but it'll definitely help you debug software/electrical issues. The below graph shows the results from my freezer test. I posted it so you can compare the results to your tests.

More information on the pressure measurement capability of this sensor can be found on the space atmospheric pressure measurement tutorial.
The Temperature Experiment
Four temperature sensors were mounted onto the space package - I did one internal and one external,
and Nick did one internal and one external. My internal sensor was placed inside my well-insulated
electronics box, while Nick's not-so-insulated internal sensor measured the air temperature just
within the cooler. Both internal measurements were important.
note 1: There were minor issues with the reliability of my external temperature sensor, as clearly visible by the blips. The blips were caused by two other poorly calibrated sensors electrically distorting the ADC. I have doubts as to if the sensor properly measured the external temperature minimum correctly or not (-30C is a bit warmer than I expected), but Nicks external temp sensor failed so there is nothing to compare it to.
note 2: The plotted altitude was determined by using a pressure sensor as my GPS failed for most of this flight. The pressure sensor error is fairly large at higher altitudes, as shown in the pressure sensor tutorial. The true top altitude was approximately ~85k feet during this particular flight.

By looking at the data, you can clearly see that the external temperature immediately starts dropping as soon as the balloon lifts off. It reaches its externally coldest point when the balloon is within the jet stream - for both the ascent and the descent.
When the balloon is at its highest altitude, it's being microwaved by the sun as there is no atmosphere to block the sun's rays. There is also no air or wind in space to cool down the package - so heat just keeps building up.
Internal Temperature
More than anything else, knowledge of the internal temperature is most important. This is where your electronics
are housed, and where insulation plays a major part.
Have another look at the internal temperature sensor in the above graph, the green line. As the balloon rises, the internal temperature drops. It finally stabilizes once the balloon goes above the jet stream, and even slowly heats back up. This is the point your electronics are most likely to overheat and fail if it's not designed properly. With our design the temperature is highest before launch - so something could even fail from overheating then!
Oh, and notice how the internal temperature lags behind changes in the external temperature. This is because it takes time for heat to move across the insulation layer.
Now, as the balloon goes up, the air inside the package gets all sucked out. So as the package re-enters the atmosphere, there is a vacuum inside of it. So air must go back in. However, the air it sucks back in is the ultra-cold air from the jet stream. This is the coldest and hence most dangerous temperature point of the entire flight. This is why you should fill the space package with foam to minimize the empty volume and hence the amount of cold air that is sucked in to the package.
The below internal temperature data is from a different flight from the data above. This flight (SB3) was poorly insulated and had many holes for air to pass through. You can see that the internal temperature clearly bordered dangerous for batteries and electronics. As mentioned in the pressure sensor tutorial, the below altitude was determined using the pressure sensor and therefore was under-reported.

Below are more data plots from our previous space launches. Every flight was different, using different insulation methods, going to different altitudes, and flying during different seasons of the year. All of this below data was provided by Nicks temperature and GPS sensors. SB3 had issues with its GPS, resulting in the flat lines, while SB5 had unexplained issues with its temperature sensor, of which Nick hasn't yet looked in to.


For further reading, see how I measured the temperature of Hurricane Sandy in 2012.
Society of Robots copyright 2005-2014